

Core Web Vitals: loading, user experience and revenue
Measure what visitors experience. Improve loading, responsiveness and stability and evaluate the commercial effect separately.

A page can look impressive and still feel slow: the main image appears late, a menu reacts after a noticeable delay or a button moves just as someone tries to press it. Core Web Vitals help distinguish these problems and turn them into measurable work.
Performance can remove obstacles on the way to an enquiry or purchase. It does not, by itself, prove that revenue will rise. Product, price, content and the quality of incoming traffic still matter.
Three metrics, three different questions
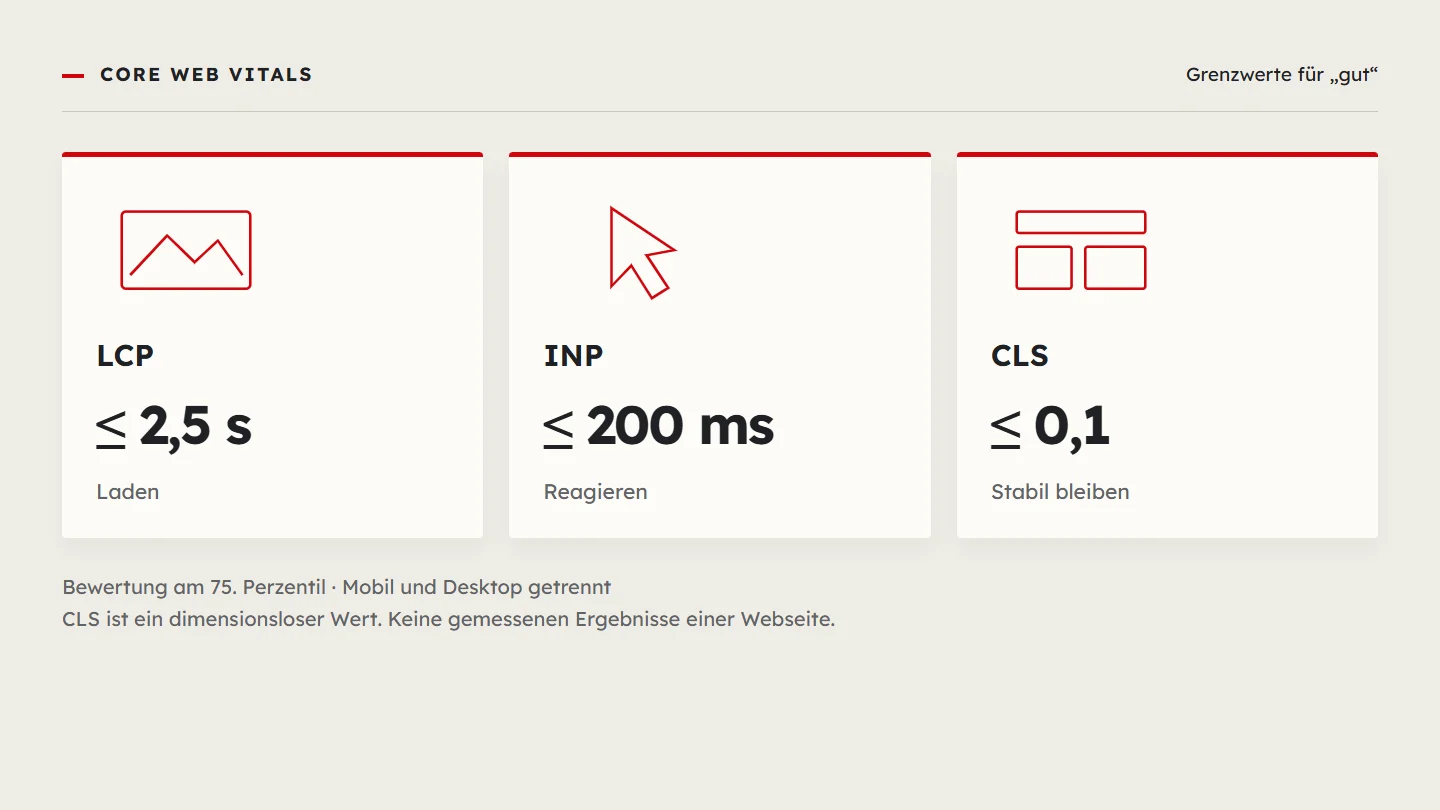
- LCP: how long does the largest visible image or text block take to appear? A good value is no more than 2.5 seconds.
- INP: how quickly does the page give visual feedback after a click, tap or keyboard interaction? A good value is no more than 200 milliseconds.
- CLS: how much does the layout shift unexpectedly? A good value is no more than 0.1. This is a score, not a duration.
Assess these targets at the 75th percentile and separate mobile from desktop. The Search Console Core Web Vitals report uses field data and groups similar URLs. Its reporting window covers the previous 28 days.
Why a fast page can help business
A product image that arrives promptly lets people assess the offer. Responsive filters make a catalogue easier to use. Stable buttons reduce mistaken clicks. Those are practical improvements to a buying journey, not just changes to a technical score.
To assess commercial impact, track the relevant outcome before and after a change, such as completed enquiries or purchases. Compare device types and traffic sources and account for campaigns, seasonal demand and changes to the offer. Use a controlled experiment where feasible. A technical improvement and higher sales occurring together do not automatically establish causation.
Google recommends good Core Web Vitals as part of page experience. They do not replace relevant content or guarantee a particular position. Google’s explanation of Core Web Vitals in Search provides the context.
Use field and lab data for different purposes
Field data describes experiences on real devices and connections. A lab test provides a controlled view of a particular page load and helps locate causes. The results can differ in either direction. A single Lighthouse score is not a substitute for all visitors’ experience.
Test representative journeys as well as the homepage: open a menu, filter a list, use a form and move between content pages. A standard page-load audit cannot observe every interaction a real visitor performs. For INP, use field data and interaction measurements. The INP documentation explains the metric across the page lifecycle.
Improve the loading path before changing everything
Identify the actual LCP element and what delays it. Check the server response, resource discovery, transfer and rendering. If the main image is the bottleneck, deliver a suitable size and format and make it discoverable early. Do not lazy-load the LCP image. Use high fetch priority selectively.
Responsive image variants help a phone avoid downloading a desktop-sized image. Choose compression by inspecting the result, not by applying one quality percentage everywhere. Prioritising every asset removes the benefit of prioritisation. The LCP optimisation guide describes the loading stages.
Respond quickly and keep the layout steady
For slow interactions, inspect long tasks and expensive rendering. Remove unused scripts, postpone optional work and divide necessary processing into smaller tasks. Check the complete journey before and after a change. Do not remove needed controls simply to improve a score.
Reserve space for images, videos and embeds. Account for font changes and content inserted above what someone is reading. Give banners a predictable place. An overlay avoids pushing the layout, but it can introduce usability problems of its own. The CLS documentation explains unexpected movement and its causes.
A useful optimisation cycle
- Choose representative pages and user actions.
- Record field values where available and run repeatable lab checks.
- Identify the largest verified bottleneck and change that first.
- Check appearance, navigation and forms alongside performance.
- Observe the next field-data window and the relevant business outcome.
Caching can reduce server work, but needs appropriate exceptions for personal content, logged-in areas and forms. Animation also deserves a real-device check: a beautiful first view should not make scrolling difficult.
The aim is a website that feels quick and reliable in use. Let’s identify what is slowing your website down.