Understand Core Web Vitals: assess LCP, INP and CLS correctly
From the right report to the actual cause: official target ranges, a delayed-image browser experiment and diagnosis without invented success claims.

A PageSpeed report looks good, but the mobile menu occasionally feels slow. After correcting an image, field assessment initially remains unchanged. These observations are not necessarily contradictory. Different conditions or periods may be compared.
This guide explains the three metrics and a traceable investigation through a fictional training page. The examples contain no measured customer successes or ranking promises. Sources were checked on 9 November 2026. Numerical thresholds come from linked official documentation rather than an invented investigation.
1. Identify the question behind the number
A report can answer several questions. How does a page behave under fixed test conditions? What do particular real visitors experience? Which resource delays the main visible content? These questions are related rather than identical.
Visitors to the example need to understand a training offer and register. An early first appearance helps little if date selection later blocks. A responsive button may also move unexpectedly when content arrives.
Describe the complete visitor journey before measuring. Include navigation, date selection and the form alongside the opening view. The measurement plan should reflect that task.
“More points” is too vague. Investigating why one interaction appears delayed on a supported mobile device, or why the submit control changes position while reading, provides a concrete starting point.
2. Associate each metric with the right experience
| Metric | Aspect | Official good range |
|---|---|---|
| LCP | Appearance of largest eligible visible content | At most 2.5 seconds |
| INP | Responsiveness of qualifying interactions | At most 200 milliseconds |
| CLS | Unexpected layout movement | At most 0.1, without a time unit |
The official Web Vitals overview specifies these targets and assessment at the 75th percentile, separated by mobile and desktop. With sufficient data, the three metrics are assessed together.
These are not grades for content, design or security. A page can meet the targets while containing confusing copy or a broken form. Technical quality needs several appropriate checks.
Keep units visible when discussing results. Treating a unitless layout value as a time obscures what should be improved. Comparing milliseconds directly with seconds without conversion can also distort a report.
3. Read the 75th percentile correctly
A percentile describes a position within a distribution. The reported value is therefore neither simply the average nor automatically the worst single visit. This matters when a fast personal experience differs from a concerning report.
Establish whether everyone is discussing the same quantity. One lab run, a field percentile and an average of internal measurements cannot be treated as interchangeable.
Document device category. A fast desktop may conceal the problem represented by mobile data. Investigate the relevant experience rather than replacing an inconvenient report with a more favourable one.
A useful result note identifies the metric, source, scope and date. That makes later comparison meaningful.
Also preserve the distinction between individual experiences and an aggregate. A successful reproduction identifies one useful case; it does not describe the entire distribution of users.
4. Separate lab and field data
Lab data comes from controlled conditions; field data comes from recorded real visits. The web.dev explanation of lab and field differences describes why the same page may produce different results.
A reproducible test is particularly useful for diagnosis. It allows a change to be investigated under comparable conditions. Interpreting actual usage instead requires understanding which experiences the field data represents.
A fresh test browser may have a different cache state from returning visitors. Devices, connections and interaction sequences may differ too. Record such distinctions before dismissing one measurement.
The perspectives complement each other. An unusual field value can trigger a focused lab investigation. An improved controlled workflow should subsequently be observed under actual usage.
5. Distinguish URL and origin scope
A report may describe one address or aggregate a broader origin. The CrUX methodology documents eligibility and aggregation. A publicly reachable page does not automatically have sufficient data for its own report.
If the training page lacks URL data, an origin value must not be presented as exclusively describing that page. Other pages can use different templates and resources.
Check the displayed scope before optimisation. Otherwise you may search the wrong page for the cause. A similar-looking domain report does not replace the scope actually stated.
Missing field data is not itself a performance verdict. The evidence base may be insufficient. Appropriate technical testing remains worthwhile for new or infrequently visited pages.
6. Investigate LCP along the loading path
The LCP documentation concerns the largest eligible visible image, text or video content. LCP is neither the first coloured surface nor automatically the end of every network request.
Identify the element observed in the actual run first. It might be the training page's large opening image or a text block. Optimising another picture may have little effect on the relevant result.
Then inspect the route to that element. Does its request begin late? Does rendering wait on other resources? Does a different screen size change which element matters? Diagnosis should explain the observed delay.
Avoid applying one loading rule to every picture. An immediately needed opening image serves a different purpose from an illustration far below. Decisions should match the actual presentation requirements.
7. Do not equate INP with one server response
The INP documentation examines qualifying click, tap and keyboard interactions throughout a visit. It concerns response until the next presentation, rather than the complete duration of every later asynchronous consequence.
For the training page, inspect whether date selection gives timely visible feedback. A server request can continue afterwards. The interface must still describe the true state rather than call an unconfirmed registration complete.
Other work on the main thread can delay even a short handler. Examine the timeline rather than only the length of the clicked control's script.
A load-only audit without meaningful interactions addresses this incompletely. Include important workflows and slower supported devices.
8. Understand CLS as stability
The CLS documentation describes unexpected layout shifts and their session-window assessment. A custom counter summing every shift across a whole visit does not automatically reproduce the metric.
Late content without reserved space is a common cause. An image above the form can acquire height and push the button down. The changing arrangement matters, rather than file size alone.
Distinguish layout changes from other visible movement. Investigation should identify which elements change layout position and why. One screenshot does not demonstrate the timeline.
Check beyond initial loading. A later notice or inserted section may affect use. A quiet opening view does not establish stability throughout the visit.
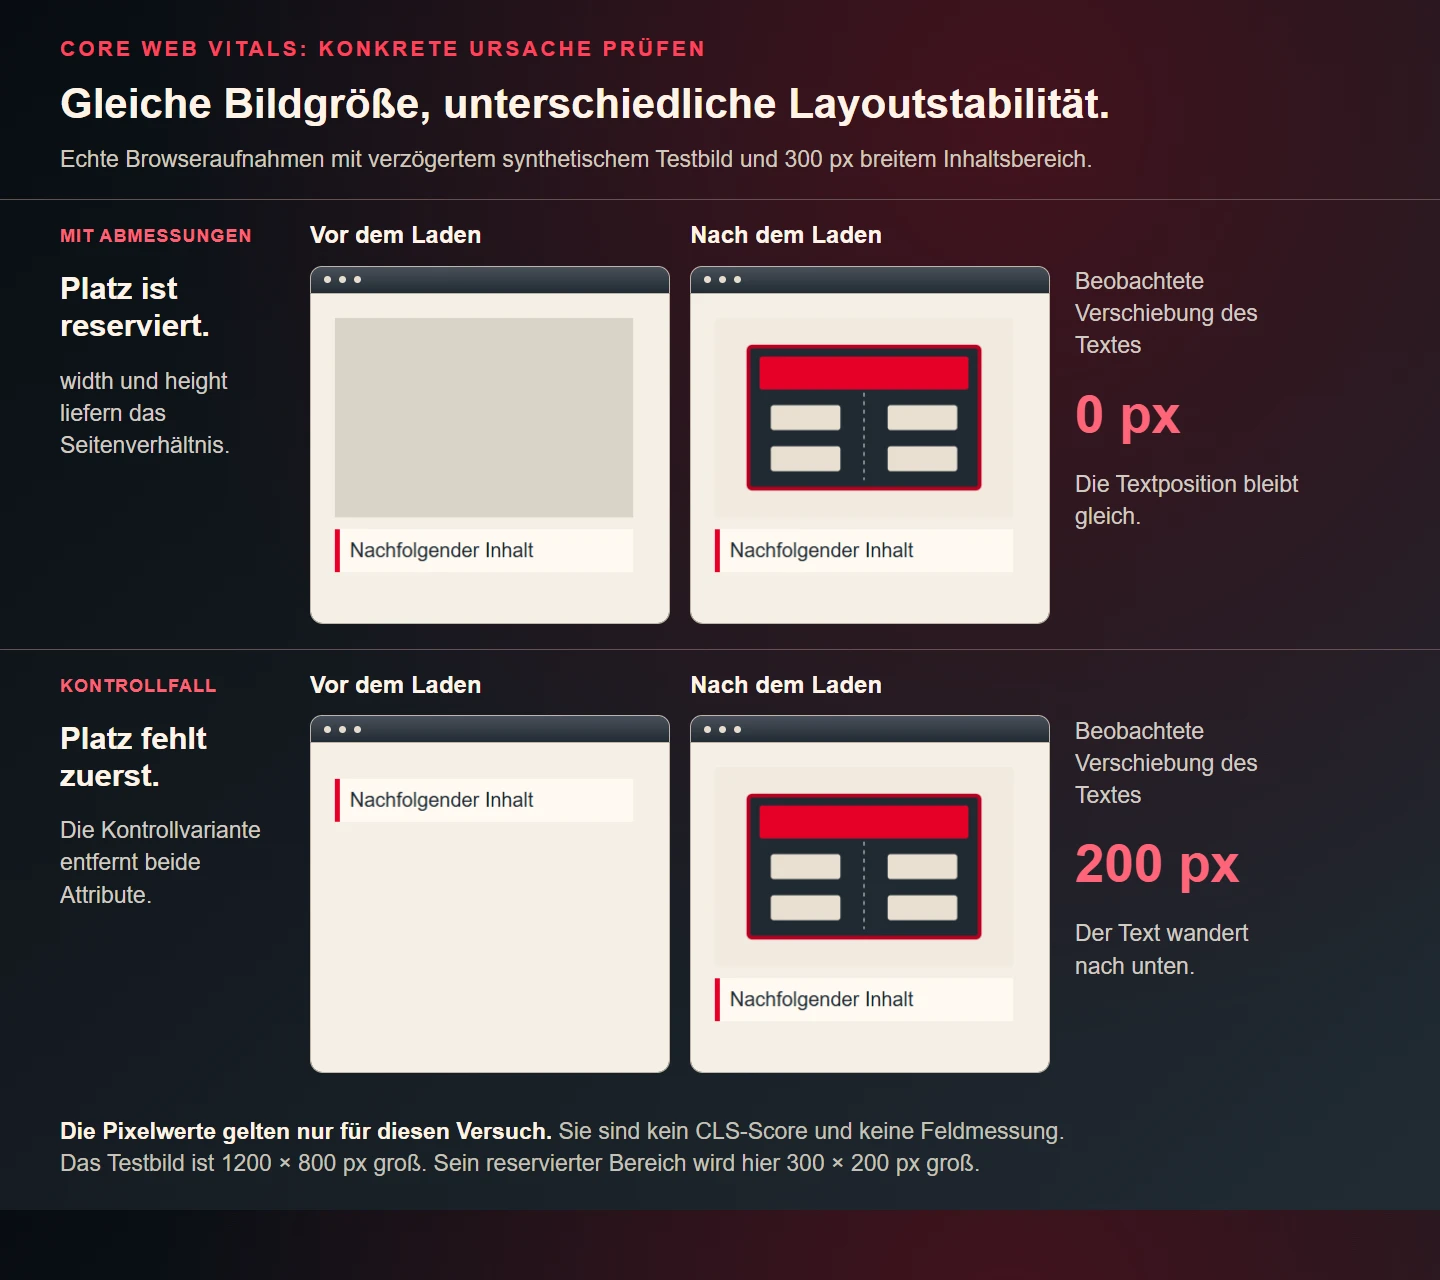
9. Reserve an appropriate image region
For an ordinary content image, suitable dimensions can provide its aspect ratio early. The web.dev CLS optimisation guide discusses images without dimensions as a frequent source of movement.
<img
  src="detailbild.svg"
  width="1200"
  height="800"
  alt="Schematic illustration of the training room"
  style="display:block;width:100%;height:auto"
>
The numbers match the test graphic's actual aspect ratio. They are not an arbitrary fixed display size. Another file needs appropriate values.
The accompanying browser experiment deliberately delays the graphic and checks the following content's position before and after arrival. It verifies that limited layout mechanism rather than measuring a real business site.
Changing crops, embeds and responsive variations require reviewing the complete design. Correct width alone cannot guarantee stability when other rules change the layout afterwards.
10. Observe individual shifts for diagnosis
The MDN LayoutShift reference documents underlying entries and limited browser availability. This example checks support and logs individual occurrences. It deliberately does not calculate full CLS.
if ("PerformanceObserver" in window &&
    PerformanceObserver.supportedEntryTypes.includes("layout-shift")) {
  const observer = new PerformanceObserver(list => {
    for (const entry of list.getEntries()) {
      if (entry.hadRecentInput) continue;
      console.info("Layout shift", {
        value: entry.value,
        startTime: entry.startTime
      });
    }
  });
  observer.observe({ type: "layout-shift", buffered: true });
}
No entry may mean no qualifying movement, or lack of support in that environment. It does not establish general stability.
Use a suitable maintained solution for regular metric reporting. A small diagnostic fragment remains useful when its purpose and boundaries are clear.
Keep diagnostic collection proportionate. This example logs numerical performance details locally; it does not add visitor tracking or send information to a service.
11. Account for the field period
The PageSpeed Insights documentation describes a preceding 28-day collection period for its CrUX experiences. Today's change does not immediately replace that complete historical mixture.
Record deployment time. Consider controlled findings alongside development in the relevant field data. An initially unchanged field value does not automatically disprove a technically verified correction.
Conversely, an improving distribution may have other causes. Devices, pages and recorded visits can change. Temporal proximity alone does not establish causation.
PSI also documents assessment with incomplete metric data. When only INP lacks sufficient observations, assessment can rely on LCP and CLS under those rules. Read the actual result rather than inventing a simplified pass condition.
12. Find a cause before changing the page
| Observation | Question | Bounded action |
|---|---|---|
| Opening image appears late | When is the correct resource requested and rendered? | Fix the demonstrated bottleneck |
| Date selection feels delayed | What work blocks the next presentation? | Reduce the specific blocking operation |
| Form moves down | Which region gains height afterwards? | Reserve appropriate space |
| Lab differs from field | Are conditions, period and scope comparable? | Establish a suitable comparison |
These are investigation directions rather than guaranteed gains. Avoid changing all images, fonts and scripts simultaneously when trying to understand one cause.
Record the expected effect first. Afterwards, verify it under comparable sensible conditions and check that existing functions survive.
13. Preserve functional quality
A faster page must still complete its task. Replacing functional date selection with a static imitation is not successful optimisation. Review behaviour alongside metrics.
Reserved space must fit the content and small screens. A huge empty block might prevent movement while making orientation unnecessarily difficult.
Feedback should remain truthful. Immediate visual acknowledgement must not claim successful submission before the business confirmation arrives. Responsiveness and accurate status belong together.
Preserve necessary content. Removing a qualification shortens the page without improving its professional accuracy. Metric work does not replace responsible editing.
14. Maintain a traceable measurement record
A useful record includes address, date, tool, device or simulation and tested workflow. Add relevant cache and network conditions. These details make later comparisons meaningful.
Retain the diagnosis alongside the outcome. An overall score rarely explains the cause. The affected resource or blocking operation matters more for implementation.
Repeat when the environment fluctuates materially or the change does not yet explain the result. Many repetitions without a clear question can merely encourage selection of favourable runs.
State limits. A passing image-reservation check is not a complete Core Web Vitals assessment. A lab result applies to its conditions rather than replacing never-collected field evidence.
Keep the tested release identifiable
A saved report should also identify the version actually delivered. If the image file or shared stylesheet changes afterwards, an old result no longer describes precisely the same implementation. Preserve a suitable release identifier with the record.
This is particularly useful when a correction must be rolled back. A comparison should establish whether the earlier implementation returned, rather than assuming that restoring one template also restored every resource it uses. Cached assets and separate release components deserve attention.
Do not expose private deployment details in a public performance report. The internal record can contain enough information to reproduce the result, while the public explanation states the affected behaviour, conditions and practical limits.
Finally, assign someone to evaluate the result after release. A recorded improvement has little operational value if a later shared change reverses it unnoticed. The relevant checks can be repeated when a concrete change or observed regression justifies doing so.
15. Put search implications in context
Google Search Central relates the metrics to user experience and search systems. Improvement is valuable when it improves actual usage.
This does not promise a particular position for a query. Content and other properties remain relevant. “Two hundred milliseconds faster guarantees first place” would not follow from this investigation.
Set goals as observable experience first. Visitors should see the offer, operate date selection and continue without unexpected movement. Those goals remain useful when search positions fluctuate.
16. Break totals into understandable stages
The official LCP optimisation guide considers the route through first-response waiting, delay before resource loading, resource transfer and subsequent rendering delay. This breakdown helps identify the right cause.
If the image has finished downloading but remains invisible, further compression may be insufficient. Equally, a late request should not simply be concealed through a smaller file. Examine the actual sequence.
The INP optimisation guide separates input delay, processing and presentation delay. Waiting before the handler can therefore matter more than that handler's own execution.
On the training page, ask whether a date-selection click waits behind other work or whether presentation afterwards takes too long. Record the observed stage so the change targets it.
Do not assume every reduction in a subpart produces an identical total improvement. Work can overlap or wait elsewhere. Repeat the complete relevant test.
17. Cover page types and states
A homepage, long course description and registration form can share resources while having different bottlenecks. Choose representative pages for actual templates. A good homepage result does not automatically establish registration quality.
Record interface state. Is the menu closed? Has a choice about optional services already been made? Is a substantial notice visible? These conditions can change the resources and regions involved.
After a shared-template change, recheck affected page types. A common image rule can alter more than the originally investigated page. Broader verification then has a concrete reason.
Include realistic data volume. A one-item date list may behave differently from the same interface containing the expected offers. A tiny demonstration should not be presented as evidence for every later dataset.
Document represented cases and remaining gaps. An intentional test selection is more informative than an assortment of incomparable reports.
18. Checklist for the next report
- Is the visitor task described?
- Are LCP, INP and CLS distinguished correctly?
- Is the source identified as lab or field?
- Are device category and period known?
- Does the result describe this URL or the origin?
- Was the actual LCP element identified?
- Were important interactions examined?
- Were later layout shifts considered?
- Does the change address a demonstrated cause?
- Do functions and truthful feedback remain intact?
19. Frequently asked questions
Why does my test differ from PageSpeed?
Check source, period, device conditions and scope first. A controlled run and a distribution of real visits are different observations.
Is CLS a time?
No. It is a unitless value describing assessed layout movement. Do not label it as seconds or milliseconds.
Can a new page without field data be assessed?
It can be investigated in a lab. That does not replace a missing real-visit distribution. Keep claims within the actual evidence.
Is a high overall score enough?
No. Examine the individual metrics and functioning task. A summary score can orient discussion without explaining every cause or the page's entire quality.