Investigating loading problems with browser tools
From an observed problem to a testable change: a practical investigation of loading, rendering and interaction.

“The page is slow” can describe very different problems. Initial content appears late, a large image takes time, text moves afterwards or an already visible page responds slowly to input. These situations do not automatically need the same intervention.
This guide describes a practical investigation using browser tools. A fictional service page with a cover image, web font and contact section provides the example. Suggested causes are hypotheses to investigate. No supposedly measured customer results or universal speed improvements are claimed.
1. Describe the observed problem precisely
Start with a repeatable task. “Open the service page at a narrow viewport and then select its contact link” is more specific than a general impression. Record which part appears or responds uncomfortably late. A screen recording can support that observation, but does not replace technical evidence.
Distinguish a first visit from a subsequent navigation. Files may already be cached on the second visit, and an established connection changes conditions too. Mixing those starting points can make a change appear effective when the comparison actually uses different conditions.
Record the address and page state as well. Is the visitor signed in, has a consent choice already been made and which sections are open? External services may start only after a choice. A test before that choice describes only part of the eventual journey.
The first useful evidence is therefore a task description with date, browser, device or emulation, network conditions and cache state. Another maintainer can use it to recreate the same situation and investigate the proposed cause independently.
2. Choose the right view of the problem
Network inspection answers delivery questions: which file is requested, when does its request start, how much is transferred and what status is returned? Performance inspection examines the browser's work during loading and interaction instead.
| Observation | Initial inspection | Not yet established |
|---|---|---|
| HTML appears late | The main document request | The server is not automatically the sole cause |
| The cover image arrives late | Its request and initiation chain | File size is only one possible cause |
| Controls respond slowly | A recording during interaction | A quick download does not prove quick interaction |
| Content shifts later | A recording and affected elements | Another caching tool cannot fix every shift |
The official guides to network activity and runtime analysis explain those DevTools areas. The project task is connecting technical observations to what a visitor is trying to achieve.
A single overall score can provide a signal, but is not a complete diagnosis. Improving one metric can worsen another aspect of the journey. After a change, inspect more than the value that initially attracted attention.
3. Establish comparable conditions
Open developer tools, select the agreed viewport and run the task under documented conditions. Decide deliberately whether the cache should be empty or populated. Disabling the browser cache is a testing condition, not a recommendation to disable production caching.
A simulated slower connection can make bottlenecks easier to see, but does not reproduce every mobile network characteristic. CPU throttling has a similar limitation: it does not turn a desktop into a particular smartphone. The simulation supports a repeatable investigation.
Repeat comparable runs. Background activity and external services can introduce outliers. Record variation rather than selecting only the most favourable result. A very small difference under highly variable conditions may not support a strong conclusion.
For the fictional page, separate initial visual loading from the response to its contact link after loading. This keeps delivery delays distinct from subsequent browser work. Both may affect visitors, but they may require different evidence and corrections.
4. Inspect the main document first
Begin network investigation with the HTML document. Did the expected response arrive successfully? Were there redirects? Was an error document returned instead of the intended page? A completed loading indicator does not prove that the correct content arrived.
Then examine the request's timing phases. Establishing a connection, waiting for a response and transferring it are different parts of the process. Long waiting time can have several causes. Do not attribute it to a particular database query without supporting server evidence.
Inspect redirect chains too. An address may move through several variants before the intended page starts. A necessary canonical redirect can be appropriate. Additional accidental detours should be identified and corrected deliberately.
For each hypothesis, identify the next evidence needed. A delayed HTML response may call for server-side measurement. If the document is available early but the page appears late, extend the investigation to dependent resources and browser processing.
5. Distinguish large files from late starts
Ask two questions about the cover image: how much is transferred, and when is the request initiated? A small image can appear late if a script creates its address only after other work. An early-discovered image can take unnecessarily long because its delivered file is oversized.
Inspect the variant actually requested. A smaller image file existing on the server does not help if the page continues to request the largest one. Responsive image declarations and calculated display size need to agree. Network inspection shows the real request rather than merely the intention in the source.
For fonts, inspect the downloaded faces and their effect on layout. Not every text block needs several additional files. A font change can also alter line wrapping, so file size alone does not explain the complete experience.
Ask the same question about scripts and stylesheets: are they needed on this page? A useful library may still be unnecessary on every route. Concrete usage evidence should guide changes to delivery rather than a general assumption that every existing file belongs everywhere.
Distinguish transferred size from decoded size. A compressed resource can use little network traffic yet still require substantial processing after delivery. Record what each size means instead of directly comparing values that describe different things.
6. Follow the initiation chain
A late request often follows a dependency. HTML loads a script, which requests configuration, then starts an image or another service. The whole chain can matter more than any individual file suggests. Investigate what caused the request to begin.
In our example, the cover could be present directly in HTML or inserted only after script execution. That distinction is testable. It leads to a concrete implementation question: does discovering this important image really need to wait for later processing?
Priority is not a guarantee of immediate delivery. The browser schedules several resources and tasks together. A hint may help, but not everything should be marked especially urgent. Giving everything the same high priority removes the intended distinction.
Change the suspected unnecessary dependency first, then repeat the task. Simultaneously changing images, fonts and scripts makes the source of an improvement harder to identify. Several changes can be combined later once their individual effects are understood.
7. Record browser work
If the page is visible but difficult to operate, network inspection is insufficient. Start a performance recording and perform the specific slow interaction. Investigate what work occurs during that period and whether a long task delays the response.
Expensive calculations, changes to many elements or repeated layout work can affect interaction. These are directions to investigate, not diagnoses established merely by noticing a delay. Relate notable recording sections to executed code and the actual user action.
The contact link might simply move to a section. If it instead triggers extensive initialisation, investigate whether that work is necessary. Some preparation might happen earlier, or unnecessary work may be removable. Shortening an animation alone does not necessarily address the actual bottleneck.
Verify functionality after a correction. A quick click that fails to produce the expected result is not a successful optimisation. Appropriate feedback, focus and information must still be provided. Performance is one property of the working journey.
8. Inspect navigation timings with a small script
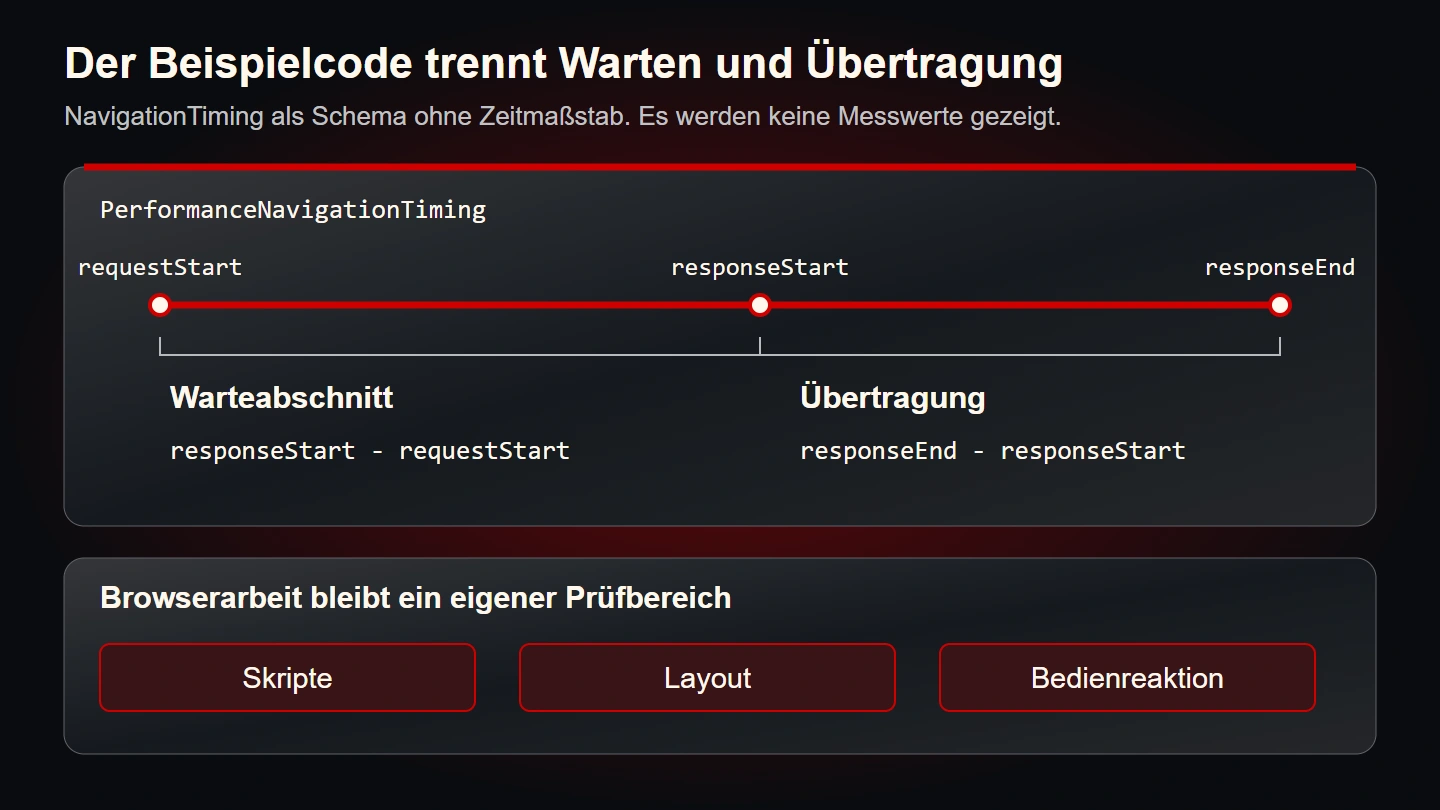
Existing navigation entries provide an additional overview. The following console script changes no page content. Run it after loading to display selected timing differences in milliseconds. The values describe this particular navigation rather than every possible visitor.
const navigation = performance.getEntriesByType('navigation')[0];

if (!navigation) {
  console.info('No navigation entry is available.');
} else {
  const timings = {
    dns: navigation.domainLookupEnd - navigation.domainLookupStart,
    connection: navigation.connectEnd - navigation.connectStart,
    responseWait: navigation.responseStart - navigation.requestStart,
    download: navigation.responseEnd - navigation.responseStart,
    domContentLoaded: navigation.domContentLoadedEventEnd,
    load: navigation.loadEventEnd
  };
  console.table(timings);
}
The MDN PerformanceNavigationTiming documentation describes the available timestamps. Some phases can be very short or zero with reused connections or particular delivery paths. These fields do not automatically explain perceived speed completely.
Reference points matter. The two event values in this example are timestamps within navigation, not just the durations of their event handlers. A short transfer also does not establish that no expensive processing occurs afterwards.
9. Separate laboratory observations from real visits
A controlled browser test examines a defined situation. Real-visit data describes the devices, connections and journeys actually observed. Both perspectives are valuable but answer different questions. A discrepancy is therefore not automatically evidence of a broken tool.
The web.dev explanation of lab and field data discusses this distinction. In practice, reproducible development tests support diagnosis, while actual visit data can help establish whether the investigated situation affects many visitors.
If suitable field data is unavailable, state that limitation. A single personal measurement is not representative of every visitor. Likewise, a domain-level report should not automatically be presented as the exact result for one particular page.
Real-visit reports may respond with a delay or represent an extended observation window after release. An unchanged report immediately after deployment does not automatically prove a fix had no effect. Check the timeframe and data scope before drawing that conclusion.
10. Turn a hypothesis into a testable change
A useful intervention connects observation, suspected cause and expected difference. “Optimise the cover” is vague. A more precise statement is that the requested variant is unnecessarily large for its rendered width. After correcting selection, the browser should request an appropriately smaller file while preserving appearance.
| Hypothesis | Targeted change | Follow-up check |
|---|---|---|
| Unsuitable image variant | Correct image variants and sizing declarations | Compare actual request and image quality |
| An unnecessary route-specific script | Limit delivery to where it is needed | The file is absent only where appropriate |
| Expensive work after a click | Remove a demonstrated unnecessary step | Record interaction and outcome again |
| An avoidable redirect chain | Use the correct direct destination | Inspect statuses and address chain |
This table supports decisions and is not a results report. Record changed files, versions and conditions for each actual intervention. The record should distinguish what changed from the effect that was observed.
11. Keep diagnostic evidence carefully
Network exports and performance recordings can contain internal addresses, parameters or sensitive information. Review their contents before sharing. An appropriate public excerpt is different from an unchecked complete raw export.
Keep clearly named before-and-after evidence for the same task. A desktop run before a change and a different mobile run afterwards are not a clean direct comparison. Where conditions differ, explain that difference explicitly.
A useful note also names unresolved questions. Browser work may have been diagnosed while server waiting remains unexplored. Separating the two prevents a limited correction from being presented as a complete performance acceptance review and helps the next person continue efficiently.
Reset special testing conditions afterwards. Forgotten throttling can distort later observations. Actual production configuration remains as intended unless changing it was part of the reviewed intervention.
12. Prioritise the next work
An initial investigation often produces several possible changes. Rank them by demonstrated influence on the visitor task, implementation effort and risk. A proven large unnecessary initial request is different from an unconfirmed theory about a rarely used secondary area.
Describe the functional boundary of each intervention. Do not remove contact capability merely to load less JavaScript. Its initialisation might be organised differently, but the offered task must remain possible. Optimisation should preserve practical value.
A useful work item contains four parts: observation, hypothesis, change and acceptance criterion. For an image, acceptance might require the appropriate variant to be requested and remain sharp at intended sizes. Then assess the timing difference under comparable conditions.
Some issues need another specialist perspective. A server-side cause cannot always be established from a browser recording. Hand over a specific observation instead of “make hosting faster”. Identify the affected address and the period being investigated.
Record which issues have genuinely been resolved. An old screenshot of a slow version can otherwise be reused accidentally as current evidence. A dated follow-up run against the released address establishes the relationship and helps distinguish later regressions from never-fixed causes.
The order is therefore not a universal optimisation list. It follows observed bottlenecks. One project starts with images, another with redirects and a third with interaction logic. The common standard is a decision that can be checked.
Keep the review proportional to the changed behaviour. If only image selection changed, verify the selected resource, its appearance and the relevant loading path. If interaction code changed, repeat the affected actions and failure states. This prevents a numerical improvement from concealing a regression in the very task the page is meant to support.
13. A reliable loading investigation checklist
- A specific slow task is described.
- Address, browser, date, viewport and initial state are recorded.
- Cache, network and CPU conditions are deliberate.
- The main document, status and redirect chain were inspected.
- Actual requests were compared with intended delivery.
- Late initiation and large transfers are distinguished.
- Interaction problems were recorded during the actual action.
- Lab and field data are not confused.
- A targeted change follows a testable hypothesis.
- Functionality, appearance and measurements were checked together afterwards.
Common questions
Does a good overall score prove the site is fast?
It is evidence under particular conditions. Important tasks and real usage conditions need consideration too.
Should the hosting provider be changed first?
Diagnose the cause first. Moving hosts does not automatically fix an oversized image or expensive browser computation.
Is a test on my computer enough?
It is a starting point. Reliable decisions require recorded conditions and suitable additional perspectives on devices and usage.
Sources and related reading
Foundations are the linked official Chrome DevTools guides, MDN navigation timing reference and web.dev explanation of lab and field data. Sources checked on 9 November 2026. Tables and the fictional scenario are original editorial aids without claimed measurement results.
For the wider interpretation, read Core Web Vitals: loading, experience and revenue. The connection to visitor tasks is explored in What a professional business website needs to achieve.