Design comparison graphics with traceable criteria
Move from a reader question to a defensible display by matching visual differences to evidenced claims.

A comparison graphic should make a decision easier to understand. Readers need to know what is being compared, which criteria are being used and what the display actually allows them to conclude. An attractive ranking based on unexplained scores can fail that purpose. A straightforward comparison with a clear foundation can fulfil it with considerable precision.
This guide develops a comparison from its reader question through to checking the finished graphic. The executed example uses two original German headings and counts units separated by whitespace. It does not rate real suppliers or claim measured effects on readers, search engines or revenue. Its deliberately narrow scope reveals how easily a correct number can acquire an unsupported interpretation through presentation.
Write the decision before drawing the graphic
Start with a complete sentence: the display should help a particular audience make a particular decision under specified conditions. A software choice might depend on a required export. A design choice might concern which version remains understandable in limited space. A general instruction to compare two solutions does not yet provide that information.
Next, question whether the audience needs an overall winner. They may instead need to understand which option suits which use. Different strengths can coexist. A matrix can reveal that distribution, while a single combined score can hide it. Choose the form in response to the decision rather than because a familiar ranking format is available.
Set the scope as well. A finding about one version under defined conditions must not silently expand to cover an entire product family. The same applies to editorial alternatives: a shorter heading is not automatically more understandable in every context. A comparison becomes more useful when its limits are visible rather than left for the reader to guess.
Criteria need a meaning someone can check
A criterion such as modern or high quality can start a discussion. A traceable comparison needs a more specific description. What should someone observe, count or assess using an agreed rule? An export format can be present or absent. File size can be established in bytes. Understanding a passage requires a different kind of investigation.
Distinguish observed properties, calculated values and professional judgements. All three can be useful. Trouble begins when a judgement is presented as though it were a measurement. Five filled stars for professionalism are a graphical claim without a rating rule. A reasoned comment describing actual observations may offer more information than an apparently precise score.
| Criterion type | Required foundation | Suitable presentation |
|---|---|---|
| Present property | Checked version and explicit definition | Named states with explanation |
| Counted quantity | Object, counting rule and unit | Numerical table or common scale |
| Measured performance | Method, conditions and measurement series | Values with relevant variation or uncertainty |
| Professional judgement | Criteria, reasoning and responsible assessment | Annotated comparison |
| Personal preference | Stated perspective and intended use | Clearly identified recommendation |
This is an editorial working aid, not a proposed scientific taxonomy. Its purpose is to prevent different kinds of statements from becoming indistinguishable. For each criterion, ask whether the required foundation exists. An empty field is not automatically a weakness of the option being considered. It may simply indicate that the information has not yet been checked.
Compare the same question under suitable conditions
A fair comparison needs comparable prerequisites. Assessing one tool in its current version and another from an old description introduces a methodological difference. Showing one design with complete content and another as an empty template also changes the basis of visual judgement. Identify these differences before selecting colours and arranging the finished display.
Prepare a short comparison record. Include the objects, their version or status, the data used and the conditions held in common. Name departures explicitly. The record does not need to be long. It should allow someone to reconstruct the basis later. A polished graphic without that connection is difficult to update reliably.
Sometimes conditions cannot be aligned completely. In that case, explain the limitation. Separate descriptions may be more honest than a shared scoring scale. Comparability is a substantive prerequisite that design can reveal. It does not arise merely because two objects have been placed next to each other on the same canvas.
A small example with executed counts
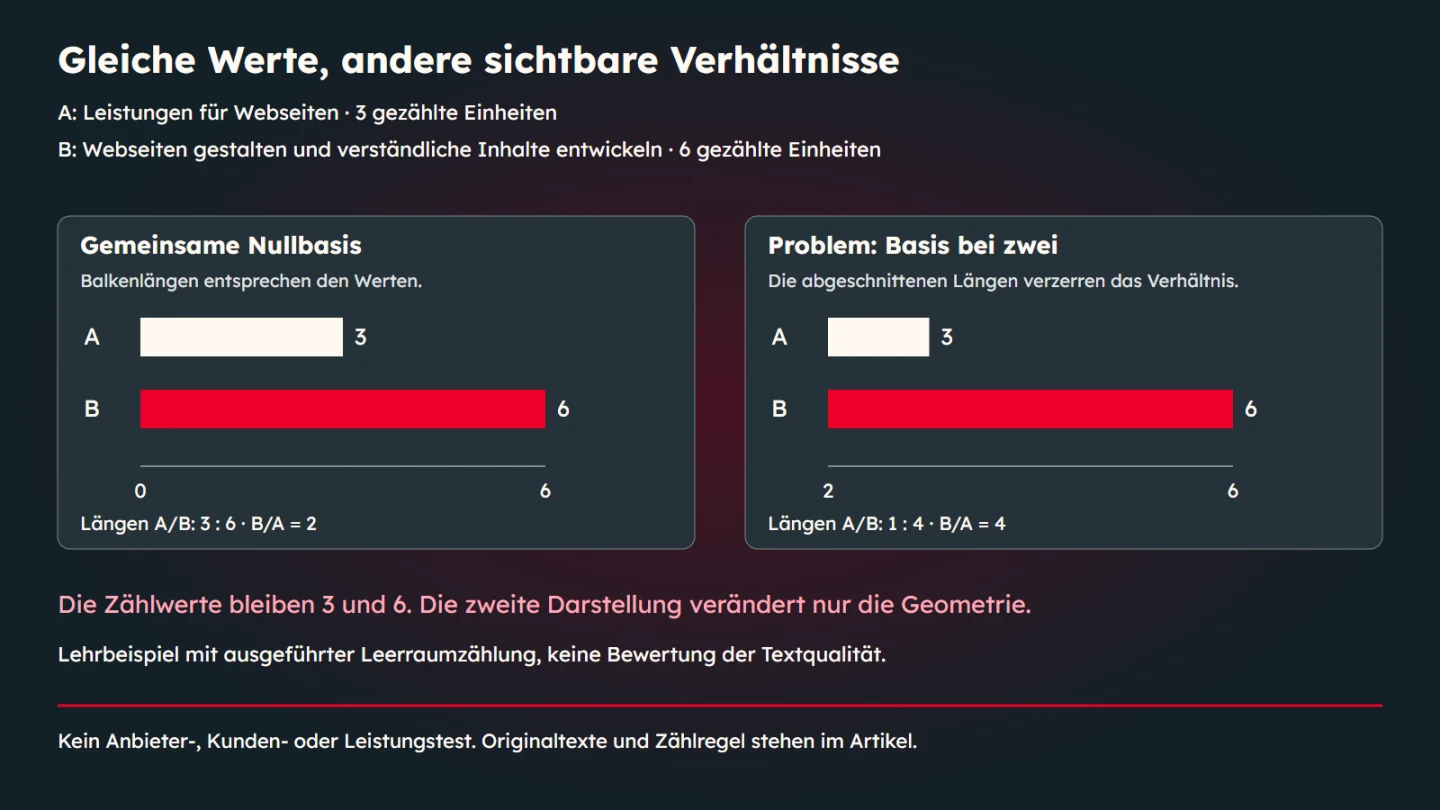
The teaching comparison uses two original German text variants. Version A reads “Leistungen für Webseiten”. Version B reads “Webseiten gestalten und verständliche Inhalte entwickeln”. Under the explicitly simple rule, each whitespace-separated unit is counted. A therefore contains three units and B contains six. Under that rule, the second version has twice the counted extent.
| Version | Original German text | Counted units |
|---|---|---|
| A | Leistungen für Webseiten | 3 |
| B | Webseiten gestalten und verständliche Inhalte entwickeln | 6 |
These numbers answer only a question about the extent of those two strings. They do not prove better comprehension or greater discoverability. The texts also contain different information. Treating them as a complete content test would first require a shared communication goal and an appropriate assessment method. Counting cannot replace that work.
This narrow definition is helpful precisely because the finished graphic is small. Its caption can say that the extent increases from three to six counted units. It should not turn that observation into an untested quality claim. The interpretation then remains as precise as the calculation supporting it.
The counting rule as inspectable code
The following code accepts strings, removes surrounding whitespace and separates the remaining content at one or more whitespace characters. An empty string returns zero. This is a deliberately straightforward rule for the example. It is neither a general linguistic word counter nor a measure of editorial quality.
function countUnits(text) {
  if (typeof text !== 'string') throw new TypeError('String required');
  const clean = text.trim();
  return clean ? clean.split(/\s+/u).length : 0;
}
const samples = [
  'Leistungen für Webseiten',
  'Webseiten gestalten und verständliche Inhalte entwickeln'
];
console.log(samples.map(countUnits));
The code was executed using the two texts printed in the article. Additional checks covered empty input, surrounding whitespace, repeated separators and disallowed input types. Those cases verify the described behaviour. They do not establish that the rule is suitable for every language or every editorial question.
Other criteria need other rules. Character length, file size and processing duration are different quantities. They should not be placed under the same ambiguous heading. Before extending a comparison, define the meaning and the unit first. Then adapt the processing and the visual representation to that definition.
A shared scale reveals the relationship
When the values three and six are shown as bar lengths, a shared zero baseline matters. On a scale from zero to six, the second bar is twice as long as the first. If an apparently comparable bar scale begins at two, the visible remaining lengths become one and four. The picture suggests a fourfold relationship while the underlying values remain unchanged.
The native explanation in this article places those two displays side by side. Both use the same executed counts. The truncated version is explicitly identified as the problematic example. It demonstrates the geometry rather than claiming that every axis in every type of chart must always begin at zero.
A line chart may use a restricted axis for a different purpose. Chart type, question and explicit labelling matter. With bars, length itself represents quantity, so shifting the baseline can strongly alter the intuitive reading. Identify which visual property actually encodes the data in the display you are preparing.
Match the form to the criterion
A table works well when precise values, several criteria and explanatory notes matter. A bar chart can make quantity differences under a common unit visible quickly. An annotated before-and-after view can explain a design change. For categorical properties, clearly named states may be more appropriate than a numerical scale.
Avoid precision that the foundation cannot support. A radar chart with six vaguely rated axes can look technical while saying little more than how its creator arranged the ratings. A combined score drawn from different units also needs a justified conversion and weighting. Addition alone does not make unrelated criteria comparable.
When weights are necessary, explain their purpose. An organisation may deliberately give some requirements greater priority. That priority is a decision, not a neutral constant of nature. A second display without a combined total can expose the information behind the recommendation. Readers can then relate the result to their own circumstances.
Missing information is not zero
An unknown value means information is missing. In a count, zero means the agreed rule counted nothing. These states must not be presented identically. An unrecorded measurement shown as an empty bar may look like particularly weak performance. Use an understandable label such as not collected, with an explanation where needed.
The same applies to criteria that do not apply to the intended use. A feature may be irrelevant rather than deficient. Giving it a poor score would misrepresent the decision. Distinguish an absent property, an unchecked property and an out-of-scope property before colour and shape add another layer of interpretation.
For samples, the amount and selection of evidence belong in the context. One observation must not quietly become a general average. Where variation or uncertainty matters to the decision, it needs appropriate treatment. A smooth number without context can make differences appear larger and more certain than the investigation supports.
Make identification easy
Label data close to where people read it when practical. A distant legend requires repeated checking and can encourage confusion. Keep object names consistent across views. If a table calls an option A, the graphic should not suddenly call it the first solution without explaining the connection.
Use colour together with text, shape or position. The WAI explanation of colour use describes why information should not depend on colour differences alone. In this example, A and B and their numerical values preserve the identification. A monochrome rendering therefore does not remove the essential distinction.
Contrast and text size also need to work at the intended output size. A large working file can become an unreadable thumbnail on a phone. Review the actual embedded dimensions. Long criterion names may require a different arrangement from short numbers. An accessible table in the article remains useful even when the graphic itself is attractive and legible.
Explain the conclusion outside the image
Complex graphics need more than a generic alternative text such as comparison. WAI describes a short identifying description and a longer accessible representation of the essential information. Depending on the content, that representation may combine a table with explanatory paragraphs. It should fulfil the graphic's purpose rather than simply list its colours.
Here, the article provides both original texts, their counts and the explanation of scale effects as ordinary text. Readers do not need to see the embedded illustration to understand the main point. The alternative text identifies the comparison and the relationships being explained. The caption makes clear that the example uses teaching data.
Keep sources, review dates and important limitations available outside a raster file as well. They become easier to find, enlarge, translate and update. A graphic can compress information. It should not be the only place where the comparison's foundation can be found at all.
Check the finished result in two directions
First work from the data to the graphic. Are values, labels, units, order and scale correct? Then work from the graphic to the interpretation. What might someone conclude without background knowledge? Does the display imply a winner when it only compares extent? Does a small difference appear dramatic because area or perspective exaggerates it?
The second check concerns more than taste. It asks whether the visual encoding supports the evidenced claim. Invite someone unfamiliar with the preparation to describe the comparison in one sentence. If that sentence claims more than the data, refine the display or its labels. A footnote cannot always undo a strong misleading visual impression.
- The reader question and scope are explicitly stated.
- Every criterion has a traceable meaning.
- Values come from documented observations or clearly identified teaching data.
- Units, conditions and relevant differences are visible.
- Missing information does not appear as zero or poor performance.
- Geometry and scales support the intended interpretation.
- A textual explanation and accessible data foundation are available.
- Sources, review date and responsibility for updates are documented.
Plan updates before the first publication
A comparison can become misleading even when it was accurate on publication day. Product versions change, a criterion becomes irrelevant or a new observation replaces an old one. Store the underlying data separately from the final image and record how the graphic was produced. An update should not depend on manually remembering which coloured rectangle corresponded to which number.
Define the trigger for another review. For a product comparison, that might be a relevant release or a changed requirement. For a teaching example such as this one, the source strings and counting rule can remain stable while the explanation is reviewed. Different comparisons need different maintenance decisions. A generic fresh-looking date does not replace substantive verification.
When changing the data, repeat both checking directions. A corrected value can alter the apparent ranking, spacing or meaning of the title. Re-exporting the image alone does not establish that its caption and article still agree. Keep the source record, graphic, accessible table and explanation aligned as one editorial object.
A recommendation can show its perspective
Readers often need interpretation as well as numbers. A recommendation is useful when its purpose and foundation remain visible. Explain, for example, why an option appears suitable for a stated space constraint. Include the observed properties and unresolved questions. Another person can then understand why the recommendation applies to that use rather than treating it as an unrestricted quality verdict.
Words such as winner, superior and more professional make strong claims. They require an appropriate foundation. Twice the number of counted units makes version B neither automatically better nor automatically worse. It first describes extent. Whether the additional information helps depends on the communication goal and requires a different assessment.
A brief editorial check can reveal ambiguity. Show the graphic to someone unfamiliar with its preparation and ask them to name the quantity and the main conclusion. Then ask what information they would still need to decide. Their answers can expose unclear labels and missing context. They are feedback on this particular draft, not representative measurements of general comprehension.
Revise the identified problem directly. An unclear unit needs a better unit label. Teaching data mistaken for customer measurements need more prominent provenance. Additional colour usually does not solve either issue. The necessary change concerns meaning and the visible connection between evidence and claim.
Sources and review date
Sources were checked on 9 November 2026. The Government Analysis Function guidance discusses chart selection, labelling and scales. The WAI tutorial on complex images explains textual alternatives. The WAI explanation of colour use discusses supplementary identifying information. The editorial review procedure and the two German headings are original examples created for this article.