Develop rating scales and matrices without false precision
Separate observation, classification and decision while exposing assumptions behind a combined result.

A rating scale improves traceability only when its levels mean something explicit. Numbers alone do not create objectivity. A matrix can organise observations, expose unanswered questions and prepare a decision. It can also suggest precision unsupported by either the evidence or the rating rules.
This guide develops scales from their purpose. It separates ordered categories, unknown information and additionally assumed numerical models. The executed calculation uses entirely constructed numbers. It rates no real supplier, product or client project. It demonstrates how weights can change an ordering and why correct arithmetic does not justify its own assumptions.
Describe the decision before designing a scale
First establish the purpose. Is a team collecting missing information, an editor checking documentation or someone choosing an option for a particular use? These tasks require different outcomes. An overall grade can obstruct an open research question by hiding missing evidence behind an apparently finished number.
State the scope too. Which documents are examined and which version applies? An assessment of documentation is not automatically an assessment of the service described. A process may exist without being explained in the material. The scale needs to identify the property it actually examines.
Separate observation, classification and decision
An observation records what the material contains. Classification assigns that observation to a named level. A decision relates the classification to a purpose. These steps can belong together without being identical. Recording them separately makes disagreement easier to investigate.
An editorial check might observe that a deliverable is named while a boundary is missing. Its classification might be partly described. Whether that gap must be addressed before publication depends on the content and purpose. A single word such as medium does not replace the explanation.
Anchor levels in recognisable observations
The original teaching rubric below considers only documentation of a service scope. It asks whether the reviewed material identifies an output and its boundary. It is not a general standard for service quality. Its anchors illustrate observations that can support a classification. Other criteria need their own definitions.
| Classification | Observable teaching anchor | Useful next question |
|---|---|---|
| Not described | No concrete output is named in the completely reviewed material | What should actually be handed over? |
| Partly described | An output is named, but the boundary remains open | Which work is explicitly excluded? |
| Concretely described | Output and boundary are identified clearly | Do those statements match the actual offer? |
| Not checked | The necessary review or foundation is missing | Which document or check is still needed? |
The final row is not a worse performance level. It describes a different knowledge state. Keeping it separate prevents missing knowledge from becoming a negative finding. Completely reviewed material matters as well. Looking at an arbitrary excerpt does not support a complete documentation verdict.
Ordered categories do not establish equal distances
The first three classifications can be ordered. That does not establish that the distance from not described to partly described equals the next distance. The Australian Bureau of Statistics explains this property of ordinal categories: order does not necessarily establish numerical differences between categories.
Coding those levels as zero, one and two first creates convenient identifiers. The digits do not make the distances measurable by themselves. An average or percentage needs additional assumptions and a useful purpose. Interpret a number no more strongly than its underlying model permits.
Unknown is not silently zero
An unknown value is not an observed zero. A count of zero can mean that the agreed rule found nothing. Not checked means the finding has not been established. Processing both identically may penalise an option merely because its documentation is unavailable.
Define missing-information treatment explicitly. The calculation here returns no overall result when a value is explicitly missing. That is a transparent policy for this extract rather than the only possible method for every dataset. Other methods require their own justification. Replacing a missing value with zero should never happen invisibly.
Weights express choices
A weight determines how strongly a criterion contributes to a numerical total. It may express a professional priority. It is not a neutral property supplied by the numbers alone. The OECD/JRC handbook on composite indicators treats weights as value judgements and discusses transparent selection.
Equal weighting is a choice too. Within the selected model it treats the components as equally important. That is not automatically wrong or assumption-free. Consider whether criteria overlap, whether the same information is counted twice and whether aggregation fits the intended decision.
A constructed numerical counterexample
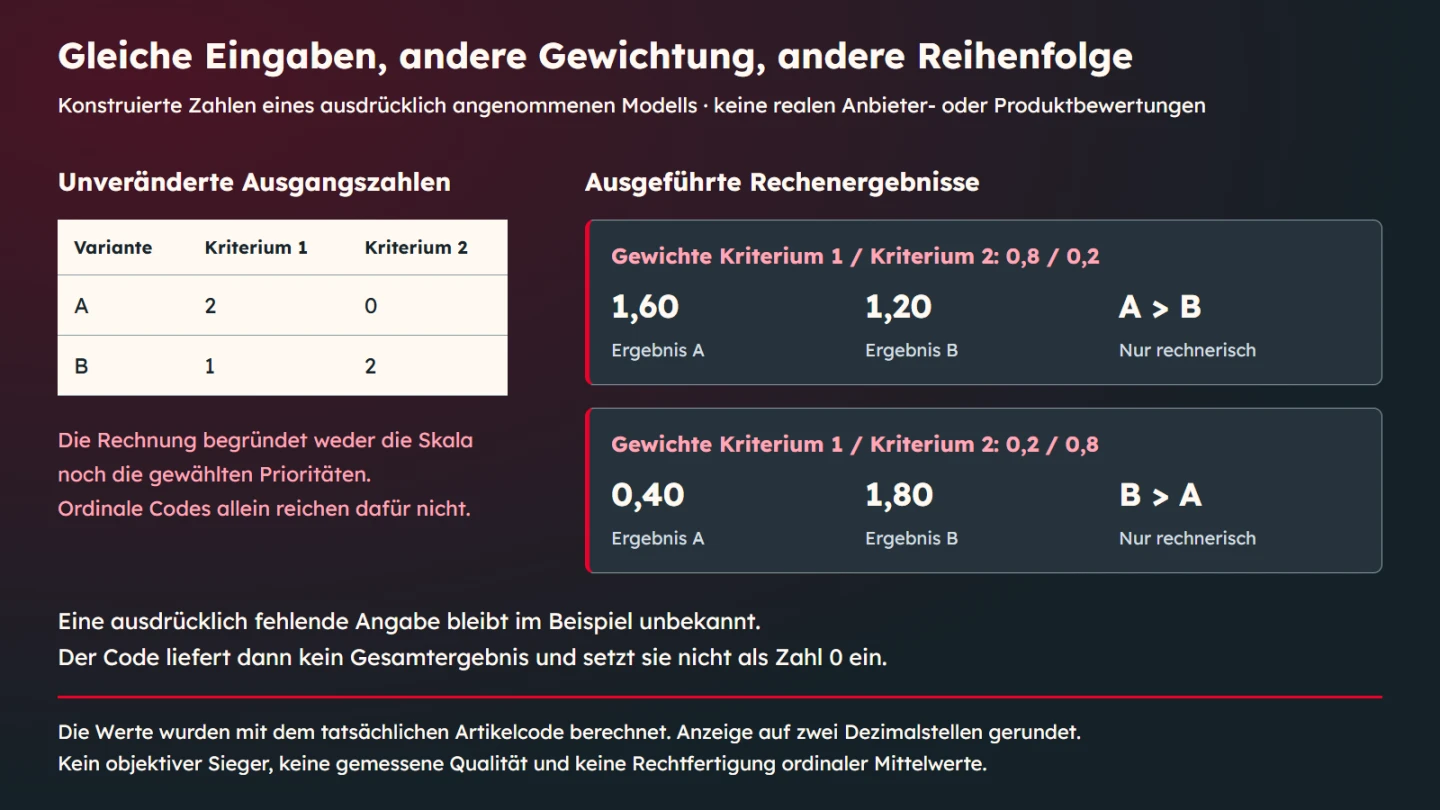
The calculation explicitly assumes an additional numerical model. Option A receives the constructed values two and zero, while B receives one and two. They come from no observations of real performance. They are not derived from the earlier ordinal teaching rubric. Their sole purpose is to reveal the effect of weighting.
Weights of 0.8 and 0.2 produce 1.6 for A and 1.2 for B. Reversing the weights produces 0.4 and 1.8. The ordering therefore changes while the underlying values remain unchanged. Chosen priorities materially affect the result. This is a mathematical demonstration rather than evidence that either option is objectively better.
| Assumed option | Criterion 1 | Criterion 2 |
|---|---|---|
| A | 2 | 0 |
| B | 1 | 2 |
| Assumed weights | Result A | Result B | Calculated ordering |
|---|---|---|---|
| 0.8 and 0.2 | 1.6 | 1.2 | A before B |
| 0.2 and 0.8 | 0.4 | 1.8 | B before A |
Make the arithmetic inspectable
The function checks input form, requires finite values and non-negative weights with a positive sum, and accounts for the weight sum. Explicitly missing data returns null. It evaluates no evidence and cannot establish whether the chosen numerical scale is professionally appropriate. Those questions precede calculation.
function weightedScore(values,weights){
 if(!Array.isArray(values)||!Array.isArray(weights)||values.length===0||values.length!==weights.length)throw new TypeError('Matching non-empty arrays required');
 if(Array.from(values).some(v=>v!==null&&(typeof v!=='number'||!Number.isFinite(v))))throw new TypeError('Finite values or explicit null required');
 if(Array.from(weights).some(w=>typeof w!=='number'||!Number.isFinite(w)||w<0))throw new TypeError('Finite non-negative weights required');
 const total=weights.reduce((a,b)=>a+b,0);if(!Number.isFinite(total)||total<=0)throw new RangeError('Positive finite weight sum required');
 if(values.includes(null))return null;
 return values.reduce((sum,v,i)=>sum+v*weights[i],0)/total;
}
const variants = {A: [2, 0], B: [1, 2]};
for (const weights of [[0.8, 0.2], [0.2, 0.8]]) {
  console.log(Object.fromEntries(
    Object.entries(variants).map(([name, values]) => [name, weightedScore(values, weights)])
  ));
}
The code was executed with both weighting scenarios. Checks also covered equivalent weights of eight and two and eight invalid input cases. An example with missing information produced no total. Readable output may round decimal places. Internal comparisons should not rely only on a shortened display.
Examine the result under changed assumptions
Switching weights is a small investigation of model sensitivity. It does not cover every possible uncertainty. The OECD/JRC handbook also examines indicator selection, normalisation, missing data and aggregation. This two-criterion example is deliberately much smaller and does not claim a complete sensitivity analysis.
For a practical decision, ask whether another defensible assumption changes the outcome substantially. If it does, reveal that dependency. A single ranking with many decimal places may hide it. Transparent individual criteria can sometimes provide a better decision aid than one overall number.
Distinguish trade-offs from prerequisites
Within its model, a weighted mean allows a lower value to be offset by a higher value elsewhere. That does not fit every requirement. A mandatory property may need to be assessed as a prerequisite. It should not disappear behind an attractive total. Define that boundary as part of the method.
Do not use a combined score as a substitute for an explicit suitability check. Identify necessary conditions separately from preferences that can be traded off. This makes a matrix easier to understand and prevents a seemingly strong total from recommending an option unsuitable for the actual task.
Keep reasons beside the classification
A rating should lead back to its observation. Record the reviewed location, version and concise reasoning. In the documentation rubric, that might identify where the output and boundary are explained. This foundation provides more information than an isolated filled cell.
If reviewers disagree, compare their foundations first. Did they examine the same material, apply the same anchor and understand the same criterion? A different number may reveal an unclear rule rather than an arithmetic error. Investigate that cause instead of merely averaging the opinions.
Design the matrix without false precision
Use understandable category names with appropriate explanations. Colour may supplement meaning but should not carry it alone. Unknown information needs an identifiable state. An unexplained white cell might otherwise mean zero, not applicable or a technical failure. Match the legend to the actual information.
Avoid decimal places that arise only from calculation and imply stronger precision. Showing 1.60 may help explain an arithmetic output. It does not make the assumed assessment more precise than 1.6. Explain what the number represents rather than treating its length as a quality signal.
Preserve an accessible data foundation
A graphic can compress the relationship. Essential categories, inputs and assumptions should also be available as readable text or a table. All constructed values and results appear in this article. Understanding the weighting effect does not depend on visually interpreting the embedded illustration.
The native explanation reproduces the executed values and identifies the additional assumption. It shows neither measured supplier quality nor an objective winner. Alternative text and caption retain that provenance. The design supports interpretation rather than dressing a teaching model as an actual market test.
Prepare a small review exercise
Before broad use, select suitable example situations. Ask participants to apply the anchors to the same material and explain their classifications. Ambiguous wording may become visible. This is not a representative reliability study, but it can expose concrete rule-definition questions before a large matrix accumulates uncertain ratings.
Revise the affected anchors deliberately. If partly described covers too many distinct cases, the question may need to become more precise. More levels are not automatically the answer. Each added distinction should be recognisable in the actual material. Otherwise, only the appearance of precision grows.
Separate data quality from decision priority
A heavily weighted criterion can still have weak evidence. Increasing its weight does not improve the underlying observation. Keep confidence in the information separate from importance to the decision. If a critical criterion is unknown, the appropriate next step may be additional investigation rather than changing the aggregation until a convenient ranking appears.
Similarly, a well-supported observation may concern an unimportant property for the particular use. Accurate data does not determine priorities automatically. Record both layers so a reader can understand whether disagreement concerns the evidence, criterion meaning or decision objective. Those disagreements require different responses.
Version the assessment when its foundation changes. A newly supplied document can alter the knowledge state without implying that the real service changed. A changed priority can alter the calculated order while all observations stay the same. Explain which kind of change occurred rather than presenting every new total as improved performance.
Build a matrix from decisions rather than a template
Start with an empty list of decisions that need support. Identify the information genuinely required for them, then derive criteria. This order prevents an existing spreadsheet from imposing arbitrary columns. A well-filled matrix is not a successful result if most of its properties contribute little to the intended use.
Examine overlap next. Understandability, clarity and traceable description may count the same observation repeatedly unless defined more precisely. Renaming columns does not make them independent. Weighting overlapping columns can silently give one concern several contributions. State the distinct subject of each criterion.
Specify the material before classifying it. Record missing sources separately from criteria that do not apply. Not applicable means the criterion has no useful role for the stated use. Not checked means the necessary knowledge is absent. Neither is identical to an observed poor result.
Check interpretation alongside presentation
Ask someone unfamiliar with the preparation to explain the matrix in one sentence. Do they interpret a documentation assessment as a general service-quality verdict? Do they read unknown as poor? Feedback can expose a concrete ambiguity. It does not statistically validate the scale, but it can improve its labels and scope.
Consider what a percentage display would imply. Converting an assumed numerical range to a percentage does not establish a measured proportion of quality. It first changes the presentation of the same assumption. If readers may infer empirical accuracy, a clearer display without that conversion can be more appropriate.
Do not treat additional decimal places as a remedy for uncertainty. An unclear professional assessment does not become more reliable when expressed through a longer number. If classification lacks a foundation, keep that visible. A useful follow-up question contributes more than a value inserted only to complete every cell.
Keep changes to the method traceable
New documentation can change knowledge without changing the underlying service. New priorities can change the ordering while observations stay fixed. A revised anchor can require fresh classification. Name the kind of change that occurred. A higher total is not automatically real improvement of the assessed subject.
Preserve the connection between criteria, rule version and evidence. An older matrix may still explain an earlier decision. It should not be combined casually with new weights without checking the relationship. Otherwise, the display mixes assessment states while merely assuming comparability.
Practical questions
How many levels should a scale have? Use as many as the purpose and observations can support. Each additional distinction needs an anchor and a meaningful application. A larger count does not prove more accurate observation. Begin with defensible differences rather than choosing a visually impressive range first.
Must every matrix name a winner? No. A reasoned comparison may show which option fits which condition or identify missing information. That can be the correct outcome. Forcing a ranking does not improve the decision when aggregation remains unjustified.
Can code decide whether a rating is fair? The code here checks input shape and executes a declared formula. It does not inspect documents, establish evidence quality or choose priorities. Those remain substantive responsibilities. Separating them makes automation more useful because its actual contribution is visible.
What should the handover contain? Include the decision question, criteria, anchors, evidence locations, missing-information policy and any numerical assumptions. Add the responsible reviewer and version. The goal is to let another person reconstruct the reasoning, not merely reproduce the final coloured grid.
Scale and matrix checklist
- Purpose, scope and reviewed version are explicit.
- Every level has a traceable anchor.
- Observation, classification and decision remain distinct.
- Unknown and observed zero are separate states.
- Numerical distance and aggregation are not inferred from category codes alone.
- Weights and mandatory prerequisites are justified.
- Dependencies on assumptions are examined visibly.
- Reasons and sources remain findable beside ratings.
- Presentation and decimals make no unsupported precision claim.
- The actual verification scope remains recognisable.
Sources and review date
Sources were checked on 9 November 2026. The Australian Bureau of Statistics explains numerical and categorical variables including ordinal categories. The 2008 OECD/JRC handbook on composite indicators addresses weighting and sensitivity. It is a methodological reference here rather than a new binding standard. The anchored rubric and all calculation inputs are original constructed teaching examples.