Make data tables understandable and usable on mobile
Develop a real data table, preserve its relationships and review a narrow viewport with explicit evidence.

Give the data table a concrete job
An understandable table connects each value to the right row and column. On a small screen, that relationship must not disappear through hidden information or an unexplained rearrangement. For many comparisons, a genuine HTML table with clear headers and a deliberately contained horizontal scrolling area provides a useful foundation. Whether it suits a particular dataset depends on what readers are trying to find or decide.
Our original example compares three maintenance services across two fictional models. Its rows describe inspection, reporting and a rollback arrangement. The columns identify a basic model, an extended model and a question to clarify. These are not actual agency packages or invented prices. The task is to identify the described service and understand what still needs agreement. Markup, styling and verification are developed around that manageable question.
When reviewing an existing table, ask what a reader should locate, compare or decide in it. If every row tells an independent story, a structured list might be more useful. A grid is not justified merely because it looks orderly. Its particular strength is a repeatable relationship between information that people can inspect through the same set of characteristics. Start from that relationship before selecting colours or borders.
Agree the meaning of rows and columns first
In this example, each row describes exactly one service. The two middle columns explain that service from two model perspectives. The final column adds a concrete question. Recording this arrangement first gives the team a way to judge later additions. A new paragraph does not belong in a table merely because an apparently convenient empty cell happens to be available.
Avoid silently changing the meaning of a column. A column that alternately contains frequency, a responsible person and a price demands very clear row labels. Our small service comparison can accommodate different descriptive values because the rows identify their purpose. A larger operational view might benefit from separate frequency, responsibility and outcome columns instead. The best structure depends on the task, not on a preference for keeping a fixed number of columns.
Use consistent terms throughout. In the example, “Separat vereinbaren” means the same outstanding agreement in both models. An empty cell could mean unknown, excluded, not applicable or forgotten. Decide those meanings before publication. A comparison can honestly expose an open decision, but it should not conceal that decision behind an attractive blank. Consistency makes the resulting table easier to maintain as well as easier to read.
Use HTML that represents the relationships
The comparison uses table, thead and tbody. Header cells are marked with th rather than ordinary td cells. Column headers receive scope="col" and the first header in each data row receives scope="row". These explicitly represent the simple relationships in this example. Bold text alone would only create a visual distinction. The document structure should carry the same meaning that the visible design communicates.
The upper-left header is labelled “Leistung” rather than left empty. It identifies what the row labels below represent. Otherwise that corner can look like accidental spacing. Even in a small table, it is useful to read each value together with its row and column labels. If that combination does not answer a sensible question, the structure or terminology may need revision before styling begins.
This design needs no merged cells. Multiple header levels, unusual spans and changing groups make the relationships more demanding. The simple pattern may then be insufficient. First consider whether several smaller comparisons would be easier to understand. A technically possible large matrix is not automatically the best reading experience for someone trying to make one focused decision. Complexity needs a clear benefit for the reader.
Distinguish the table name from instructions
The caption names the particular contents: three services across two fictional models. A heading introduces the section, while a nearby paragraph explains that a wide table area can be moved sideways when space is limited. Those texts have separate responsibilities. A concise content name should not become a lengthy operation manual or repeat every cell before the reader reaches the actual data.
The scrollable region uses the visible section heading as its accessible name and references the instruction separately. This keeps orientation available outside the moving table contents. The caption itself may move out of the visible horizontal slice, while the surrounding heading and instruction remain in their ordinary document position. We deliberately check this behaviour in the narrow rendering rather than assuming the relationship will remain obvious.
A further summary may be useful for a more complex comparison, perhaps explaining groups or the scope that is intentionally omitted. Our small example needs only a brief introduction. Do not add several nearly identical titles simply because each is technically available. The purpose is a helpful entry into the data, not the longest possible sequence of preliminary descriptions before the first useful value.
Follow the complete small example
The snippet below includes the entire comparison and its scrolling instruction. An unanswered clarification question is not presented as a service already delivered. In particular, the rollback row remains an agreement to make. Anyone adapting this for a real offer must determine the contents anew. A table structure does not turn fictional demonstration information into an existing commercial commitment.
The wrapper has tabindex="0", a region role and a visible naming source. This is a deliberate simple choice for one bounded dataset. It also creates an additional reachable region in wide layouts. A page containing many tables needs to weigh the value against the longer focus sequence and may benefit from a tested enhancement that focuses specifically on genuinely overflowing regions. That is a separate improvement, not an excuse to remove keyboard access from a narrow table.
<h2 id="maintenance-title">Wartungsumfang vergleichen</h2>
<p id="table-help">Falls die Tabelle breiter als der verfügbare Platz ist,
  können Sie den Tabellenbereich seitlich bewegen.</p>
<div class="table-scroll" tabindex="0" role="region"
     aria-labelledby="maintenance-title" aria-describedby="table-help">
  <table>
    <caption>Fiktives Beispiel: drei Leistungen in zwei Modellen</caption>
    <thead>
      <tr><th scope="col">Leistung</th><th scope="col">Basis</th>
          <th scope="col">Erweitert</th><th scope="col">Prüffrage</th></tr>
    </thead>
    <tbody>
      <tr><th scope="row">Prüfung</th><td>Monatlich</td><td>Monatlich</td>
          <td>Welche Auffälligkeiten wurden festgestellt?</td></tr>
      <tr><th scope="row">Bericht</th><td>Kurzprotokoll</td>
          <td>Einordnung mit nächsten Schritten</td>
          <td>Was muss die zuständige Person entscheiden?</td></tr>
      <tr><th scope="row">Rückweg</th><td>Separat vereinbaren</td>
          <td>Separat vereinbaren</td>
          <td>Wie wird eine Änderung bei Bedarf zurückgenommen?</td></tr>
    </tbody>
  </table>
</div>
<p>Das Beispiel zeigt keine tatsächlichen Agenturpakete oder Preise.</p>
Contain horizontal movement in the table area
The wrapper uses max-width:100% and overflow-x:auto. The table has a chosen minimum width of 46rem. Where space is limited, the comparison stays a table that can be explored inside its wrapper. The entire page should not extend sideways beyond the viewport. This minimum is a design value for these four columns, not a universal mobile-device boundary or a rule to copy into every unrelated table.
Visible focus identifies when keyboard navigation has reached the region. The actual browser check then exercises horizontal movement with the right arrow and a subsequent Tab step out of the region. A CSS declaration alone is not evidence of useful interaction. Physical touch devices and relevant assistive combinations still require review in the deployment context. Our desktop evidence does not claim to cover those additional environments.
The focusable region must not trap keyboard navigation. Readers need to leave the data and reach the next part of the document. Long tables also raise questions about retaining orientation after many rows. Our three-row example stays deliberately small. A comprehensive operations dataset might call for search, filtering or sensible subdivision, each of which would introduce its own interaction and acceptance requirements.
Design spacing around actual labels
Cells receive readable padding, a restrained border and top alignment. A strong red header with white text distinguishes the column headings, while pale row-header backgrounds support the other axis. These visual cues complement relationships that remain encoded in HTML. Colour alone would not be enough to identify the meaning of each value or to communicate which cells are headers.
The first browser draft broke short row labels in awkward places. The revised first column therefore has an eight-rem minimum and keeps these brief labels together. This correction follows the real content rather than imposing a rule on every table’s first column. A long free-form description would need different handling. Other data cells can wrap within their areas to accommodate longer information.
Subtle alternating backgrounds may help readers track longer rows, but they do not replace headers. A narrow slice should also communicate that more information exists horizontally. The instruction is consequently part of the interaction design rather than a decorative caption attached after the layout is finished. Its usefulness belongs in the same acceptance review as line spacing, contrast and the table’s surrounding text.
Review the CSS together with the data
The following CSS belongs to the preceding HTML. It does not replace the table’s semantic role or create substitute labels through generated content. Its minimum width depends on the root font size. When that size increases, the space required by the table grows accordingly, and the wrapper must continue to contain it. A root-text enlargement test should be described accurately rather than being passed off as a complete browser-zoom conformance review.
overflow-wrap:anywhere supports exceptionally long uninterrupted values within ordinary data cells. It is not used to truncate the underlying information. A filename remains present even if it occupies several lines. The short row identifiers receive a deliberate exception to wrapping. Different content categories therefore get different treatment instead of forcing one rigid word-breaking policy across every part of the comparison.
.table-scroll { max-width: 100%; overflow-x: auto; }
.table-scroll:focus-visible { outline: 3px solid #cf0711; outline-offset: 4px; }
.table-scroll table { width: 100%; min-width: 46rem; border-collapse: collapse; }
.table-scroll caption { text-align: left; padding: .9rem; font-weight: 700; }
.table-scroll th, .table-scroll td { padding: .9rem; border: 1px solid #73787b;
  text-align: left; vertical-align: top; overflow-wrap: anywhere; }
.table-scroll thead { background: #cf0711; color: #fff; }
.table-scroll tbody th { background: #e9e4db; color: #202326; }
.table-scroll tbody td { background: #fffaf0; color: #202326; }
.table-scroll tbody tr:nth-child(even) td { background: #f0ece4; }.table-scroll th:first-child { min-width: 8rem; width: 8rem; white-space: nowrap; }
Keep important information available on narrow screens
A quick responsive treatment sometimes hides the last columns. In this example that would remove the clarification question, which is precisely the information explaining an outstanding decision. The grid would look more compact while becoming less useful. We therefore retain all values in the same document. Horizontal exploration is the intentional trade-off for maintaining the complete comparison in this particular workflow.
A card-based alternative may be suitable for another task, but it needs to preserve the relationships clearly and have its resulting semantics reviewed. Applying display:block to table cells does not guarantee that outcome. Maintaining a second mobile copy also creates an editorial dependency: every service change must reach both versions consistently, preferably through the same authoritative data rather than repeated manual editing.
For our modest comparison, the preserved table is the chosen solution. Someone checking the status of one individual job might instead need a focused detail view and no broad comparison at all. That decision follows the activity being supported. Calling an interface “mobile” is not by itself a reason to hide arbitrary data or convert every dataset into a long series of independent cards.
Make units and missing values unambiguous
This comparison deliberately contains no amounts of money. A real cost table needs a currency, period and clear net or gross meaning. An isolated number such as 120 would be inadequate there. Percentages likewise need a defined reference. Numeric alignment may help comparison but cannot supply a missing business definition. Establish the meaning of values before refining their typographic appearance.
Dates also need context. An appointment, a last-reviewed date and an expiry date are different facts. If individual rows have different data ages, make that visible rather than using an indiscriminate “current” heading. A regularly maintained comparison benefits from a small data agreement covering source, owner and permitted representations of unknown information. That agreement helps future editors avoid accidental contradictions.
Do not assign the same arbitrary dash to every empty situation. Not applicable, still to be agreed and not yet examined are different statements. Our example uses the explicit wording that the matter needs a separate agreement. The handling team can then see which decision remains open. Tables save explanation when they preserve important distinctions rather than replacing all of them with the same compact symbol.
Add interaction only where it helps the task
Our three service rows do not need sorting. Their order moves from inspection to reporting and then rollback arrangements. An alphabetical sorting action would introduce extra controls without helping a relevant search. For a large dataset, sorting may be central. In that case, distinguish an actionable header from a label that merely identifies a column. The interaction needs a clear role rather than an unexplained visual affordance.
A numeric sort must not accidentally compare formatted numbers as arbitrary strings. Dates need suitable underlying values while retaining readable presentation. The active sort state should be understandable and preserved appropriately after changes. Those requirements apply whether a library or original code provides the feature. Every added capability extends the review contract and brings more cases that need deliberate expected outcomes.
Filters also require orientation about remaining results. An empty view should distinguish an absence of matching data from a failed request. That complexity would not help this static small comparison, so we omit it. The acceptance effort stays focused on complete content, clear relationships and a controlled narrow view. Leaving out unnecessary interaction can be a reasoned usability decision rather than a missing feature.
Read the evidence from the executed browser checks
The actual HTML and CSS were exercised in desktop Edge with 34 checks. The table is discoverable by its caption and exposes four column headers and three row headers. Its table role remains intact. At viewport widths of 320, 390, 900 and 1440 pixels, the data are not hidden or rearranged. At the smaller widths, the additional horizontal space stays inside the designated region rather than widening the page.
Keyboard behaviour was exercised rather than inferred. The region receives focus, the right arrow moves its horizontal position and another Tab step leaves it. Separate cases increase the root font size and insert a long uninterrupted value. These named observations are more useful than a broad statement that a single CSS declaration automatically makes a table appropriate for every context.
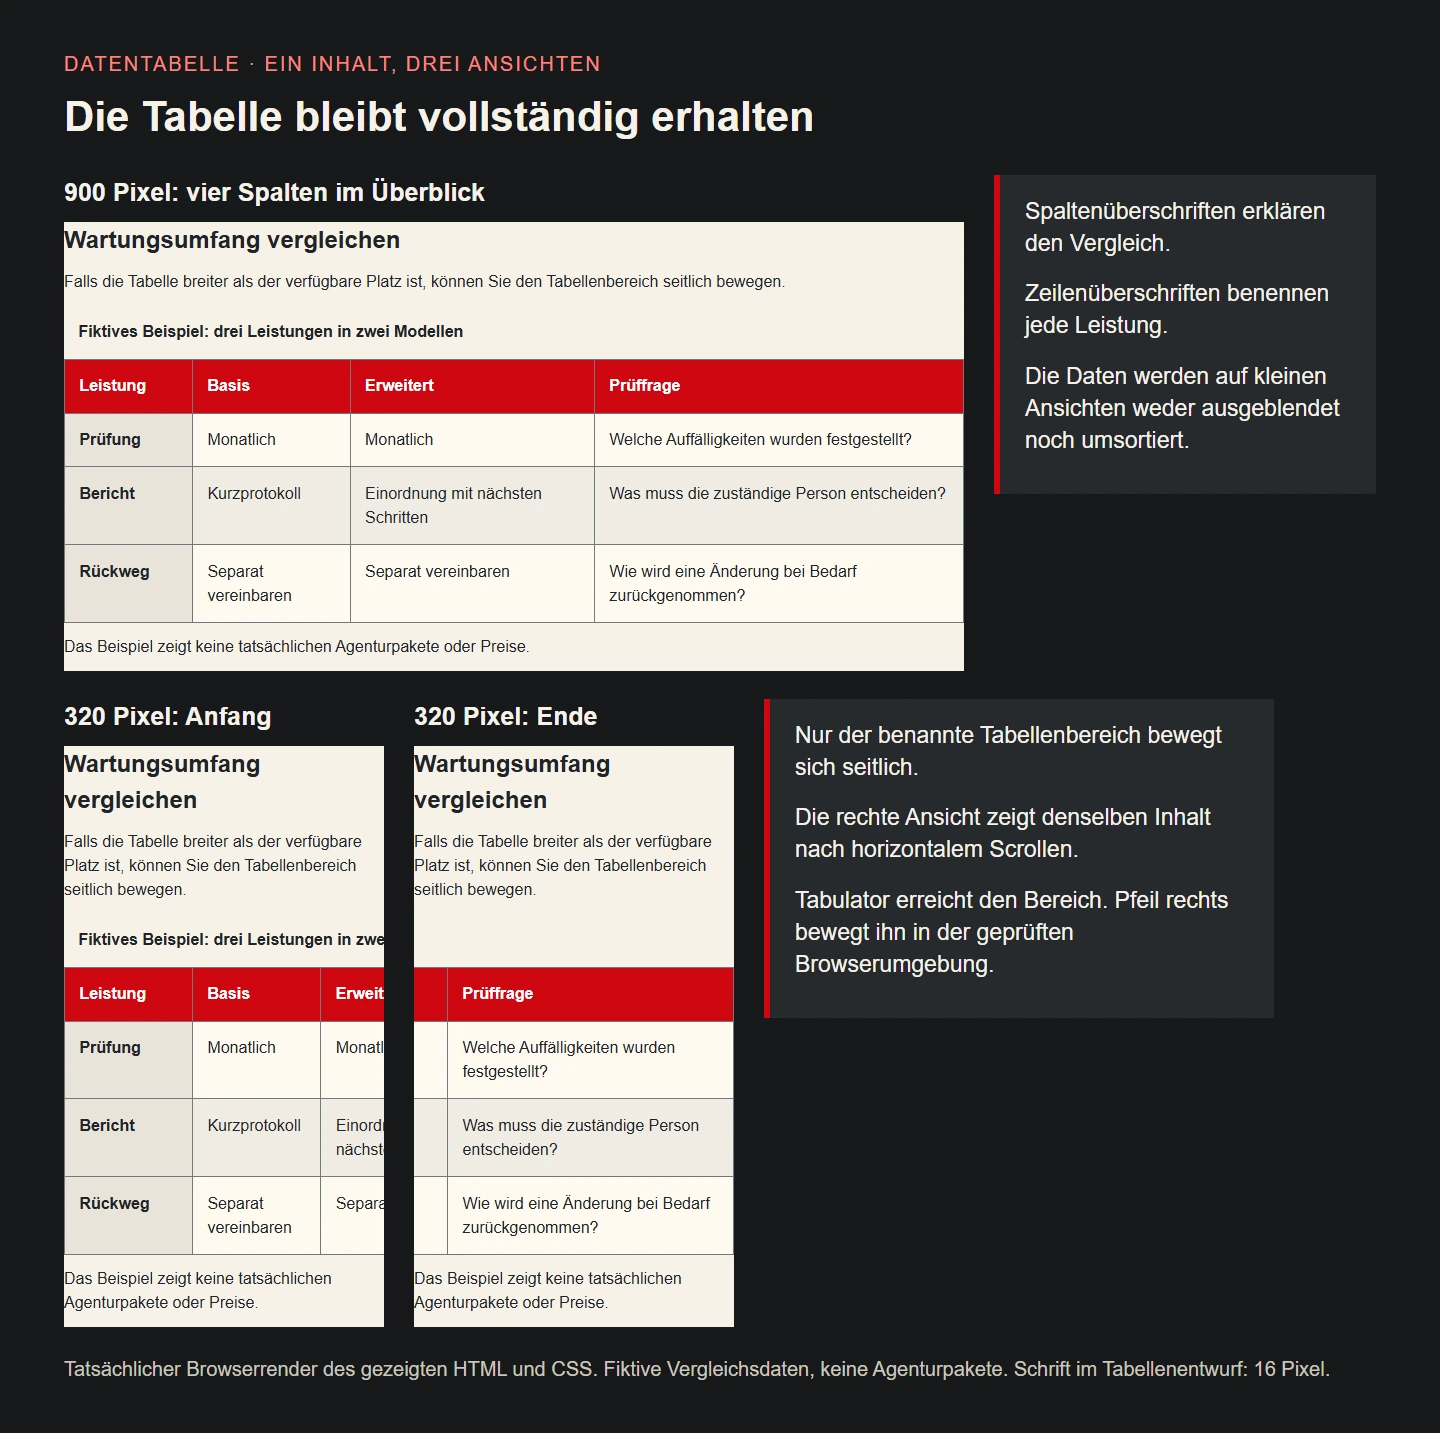
The illustration shows the same design in a 900-pixel wrapper and twice at 320 pixels. One narrow view starts at the left edge, while the other shows the end after horizontal movement. These are actual browser renderings with fictional comparison data. They demonstrate the specified layout, not a real maintenance offer or compatibility with every possible assistive-technology setup. Keep the meaning of each type of evidence clear.
Accept the component through real reading tasks
Give a reviewer a concrete question: how do the reports differ and what remains open about rollback? Ask them to find the answer on a narrow screen and then compare another service. Observe whether they discover the horizontal information and retain the row relationship. A neat preview image alone does not answer these questions. Task completion matters more than the visual impression of the first unscrolled slice.
Also review longer content from the intended deployment. A changed model name, a different language or an expanded clarification can alter the distribution considerably. A useful test dataset contains more than short convenient words. Our isolated long-token case examines page containment, while a real team must additionally decide whether such values belong in this overview or need a separate detail route.
Handover identifies the authoritative source of the comparison and the person responsible for updates. A new column calls for renewed review of naming, order, containment and narrow rendering. The table remains a business component rather than a frozen decorative asset. A passing result for the original example is not permanent approval for arbitrary future volumes, relationships or interactive behaviours.
Practical questions about responsive tables
May a data table scroll horizontally? That can be appropriate for genuinely two-dimensional relationships. WCAG’s reflow explanation separately considers content requiring a two-dimensional layout. This is not a blanket justification for widening the entire page. Surrounding prose still needs to reflow readably, and the table area must remain discoverable and operable. The actual content and complete interaction determine whether the design works.
Should the first column remain sticky? In a large wide comparison that may support orientation, but it can also obscure values and leave little useful width. This small example does not need that extra treatment. If introduced, check narrow views, backgrounds, focus and the final data area. A persistent region only helps when its behaviour supports the reader’s task without covering the information being sought.
Could the table simply be an image? An ordinary data table would then lose machine-readable relationships and flexible text presentation. Our illustration therefore explains an HTML design rather than replacing its data. The underlying information belongs in suitable structured markup or an appropriate data route. An image may communicate the arrangement and needs its own meaningful alternative text for the information it contributes.
Checklist for an understandable data table
- The reader task and comparison characteristics are agreed.
- Rows, columns and missing values have explicit meanings.
- Caption, header cells and relationships fit the data.
- Required information remains available in narrow views.
- Horizontal movement stays within the named region.
- Keyboard access, exit and long content were actually checked.
- Small layouts and larger text were reviewed with realistic content.
- Data ownership, change review and further device checks are defined.
Sources and technical review
Primary sources reviewed on 9 November 2026. The maintenance models and comparison data are original fictional examples. The 34 browser checks concern the displayed HTML and CSS.